
Stocks question
 How do I calculate the Average True Range on stocks to set a stop loss position?
 Damian Isbister, TraderDealer
Any successful trader will tell you that stop losses are essential to a good trading strategy, but knowing where to place your stop loss is less obvious. Average True Range (ATR) can be an effective way to set stop loss positions and profit targets, and avoids the problem of being stopped out early.
What is the Average True Range?
Essentially, the ATR is a measure of the volatility of a stock, and can be calculated and used on any trading instrument over any time frame. It was first developed by Welles Wilder and published in 1978. It was originally applied to commodities and was developed to capture the effect of the opening gap on price movement and volatility.
True Range
To calculate the ATR the first thing you need to understand is the True Range. The True Range is defined as the largest of three measures:
• Today’s High less Today’s Low
• The absolute value of Today’s High less Previous Close
• The absolute value of Today’s Low less Previous Close
We use the absolute value, which means the number will always be positive.
It is important to remember that while I have used the calculation here for a daily True Range, the same principle can be applied to any time frame.
In this chart, you can see the True Range for a series of days shown by the black boxes. If the candle is large it is more likely that the True Range will be calculated as High less Low. Small candles coupled with opening gaps will result in one of the other calculations being used for the True Range.
The ATR then is just an average of True Range over a specified period of time. So if you wanted to use an ATR(7) you would add up the True Range for the last 7 days and divide by 7 to get the ATR value.
In effect the ATR measures the average daily range including any opening and closing gaps. The time period you use is not that important, with shorter time frames making the indicator change more and longer time frames smoothing the indicator out. Typically averages of 3 – 14 days would be used.
Fortunately most charting software packages will do the maths for you, and plot the ATR above or below the chart, shown below in blue.
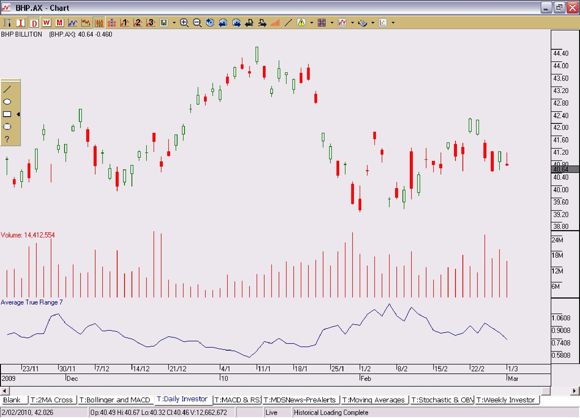
As you can see, the ATR for this share fluctuates as the volatility of the share changes, from a low of $0.50 to a high of $1.20.
Stop Placement
All that’s very interesting of course, but now that you know about calculating the ATR, what do you do with it?
Since the ATR shows you the normal daily movement of the share, you now have a set of parameters to guide you to where to place your stop loss. If you place your stop loss inside the normal daily movement then it’s likely that the stop will be hit within the normal trading action. The whole purpose of the stop is to get you out if there is an “abnormal” movement, i.e. a trend change.
So any stop placed less than 1 ATR from the price action is too tight, and you’ll be stopped out unnecessarily. This is why stop placement should be 1- 3 times the ATR away from the price.
When trading long (buying shares), stops are usually calculated from the low price, though some traders choose to calculate stops from the closing price or from the high price, which is referred to as a chandelier exit. If in doubt choose the low price for your calculations.
On the chart above, BHP is trading at $40.64, with a low of $40.60, and the ATR(7) is $0.74. To calculate the position of a stop, subtract 2 times the ATR from the low. So in this case:
Low – (2 x ATR) = Stop
$40.60 – (2 x 0.74) = $39.12
As long as your broker allows stop orders, you can place an order to sell BHP if it drops to $39.12 today.
To trail the stop loss simply redo the calculation tomorrow and adjust your stop to the new level. Try a few different multiples between 1 and 5 (decimal points can also be used e.g. 1.5) to match the stop placement to your trading timeframe. Remember, the larger the multiple the longer you will hold your positions.
ATR Stops vs Percentage Stops
Using the ATR to calculate stops can work well on a share, regardless of the price or volatility. An alternative approach is using a percentage stop, which is always the same distance from the share price: very wide on a high-priced share and very near on a low-priced share. The ATR-based stop automatically adjusts for the share you are trading regardless of its price and as the volatility changes the level of the stop also changes. This flexibility gives the ATR stop a definite advantage over a fixed- or percentage-based stop.
The stop strategy you use will depend on your style of trading, and it’s important to test your ideas to ensure that they work before trading with real money. But whichever approach you go with, just remember to always use stops in your exit strategy.
Damian Isbister CEO Software and Online Trading, TraderDealer
Other articles in this week's newsletter
Portfolio Watch: Stocks fuelled by China's growing economy
Evaluating A Company's Management
How can I calculate the Average True Range on stocks to set up a stop loss position?
3 Reasons Not To Trade Range Breakouts
Top 10 CFD stocks for the week
» Subscribe to TheBull's free weekly newsletter to receive all the latest news and views from Australia's leading journalists. Ask us a question
![]() Free newsletter
Free newsletter
Click here to receive TheBull's free newsletters on stocks, trading, investing and more.
TheBull.Asia newsletter -
FREE!

NEWS FEEDS

Commodity Price Update
In-depth analysis of recent price moves, market forecasts and explanations of the economic and political factors driving the commodity markets. Click here.

FX Forecasts
The Weekly Currency Trading Forecast from DailyFX Click Here.

Forex education
Includes trading tips, technical analysis lessons, and strategy guides. Click here.
MoreRELATED ARTICLES

New stock market crash, a pattern?
The third industrial revolution started around 1940 and is nearing its end.

4 hot Hong Kong stocks
Joseph Lai at Platinum Asset Management expects data-related revenues to skyrocket from a low base...

Top Chinese property and oilfield service stocks
Two Asian analysts share their top picks within China's property and oilfield services sectors.
MoreNEED TO KNOW TERMS
RESOURCES & OFFERS

Free Investing Newsletter on Asian and Australian markets. Be ahead of the curve with TheBull.
Read more
Join CommSec now and get $600 free brokerage.
Find out more