
Forex question
 How to analyse price charts and use trading tools before you trade the markets
 Brendan Gunn, GFT
Market trading, like any mental exercise, requires a bit of knowledge and expertise before you really can give it a go. For many traders, that knowledge starts with not only having a sound trading plan, but also in techniques that help analyze a market in question – whether one wants to track and trade commodities, equities or foreign exchange markets.
While there are a number of tools and methods you can use, any trader will tell you that the secret to profitable analysis starts with looking at price charts – the core of using technical analysis for trading. First, it’s important to recognize the basic use of charts, their principles of use, what types of analysis tools can help in reading price charts, and whether the use of supplementary tools and software programs can assist in making a trading decision.
Price charts plot the real-time prices of a particular market on a graph and provide a snapshot of market movements over a particular period (plotting price action over time). While basic line charts are good for getting a quick read on the market, many traders prefer to look at charts that provide a little more information about market movements, such as bar or candlestick charts. These kinds of charts have an easy-to-analyze appearance that provides detailed information about the price movements of a market – see the bar chart below illustrating the Euro-dollar currency pair.

Source: GFT’s DealBook® 360
Each bar on the chart is defined by four price points (high, low, open and close). The length of the bar represents the range of trading activity for a specified period. For example, on a chart with a ten-minute time scale, a bar would represent all of the trading activity on the market in a ten-minute period.
There are hundreds of charting tools that can assist with chart-reading (referred to as technical analysis), just as there are hundreds of methods traders can use. One time-tested method traders use is support and resistance levels, which are price points that the market consistently hits and then reverses its direction.
Support usually refers to points that prices drop to before rising. Resistance refers to points that prices rise to before dropping.
A second type of tool, called market indicators, display trend lines either over the recent market movements on a chart or in a separate area below the chart (in some charting packages).
These indicators can be either lagging, which analyze past market price movements, or leading, which look at current price movements. Bollinger Bands, Average Directional Index (ADX) and Moving Averages are all examples of lagging indicators, and there are numerous types and hundreds, if not thousands of variations.
Third, patterns give you an indication of likely market movements because they are price points that move and “develop” into a particular arrangement. Some common patterns are flags, channels and triangles. Other more complex patterns, such as ABCD patterns or Fibonacci levels can also be heavily relied upon to determine future market direction.
But sometimes traders need an extra bit to help them time and see market patterns. Today’s charting packages are offered by many dealers when you open a trading account, and provide you with many of these tools.
For example, charting tools can be classified into two distinct types: a pricing indicator and a timing indicator. A pricing indicator can tell you at what price a high-probability trade may be made, but it cannot tell you what time that price may be reached. Tools that help you find repeating market patterns can be classified as such and many market makers offer them.
Charting and technical analysis is the basis for many traders, helping them make time-tested, sound trading decisions. If you are using charts, support and resistance, market indicators and price patterns are all methods that you can use to increase your decision-making power.
Brendan Gunn, Sales Manager, GFT
Other articles in this week's newsletter
Try these bonds for size - low risk, big yields
What records must you keep for the tax man?
Updating the trust deed in a SMSF
How to analyse price charts before making a trade
Stocks & Stats to watch out for this week
» Subscribe to TheBull's free weekly newsletter to receive all the latest news and views from Australia's leading journalists. Ask us a question
![]() Free newsletter
Free newsletter
Click here to receive TheBull's free newsletters on stocks, trading, investing and more.
TheBull.Asia newsletter -
FREE!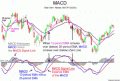

NEWS FEEDS

Commodity Price Update
In-depth analysis of recent price moves, market forecasts and explanations of the economic and political factors driving the commodity markets. Click here.

FX Forecasts
The Weekly Currency Trading Forecast from DailyFX Click Here.

Forex education
Includes trading tips, technical analysis lessons, and strategy guides. Click here.
MoreRELATED ARTICLES

Shares rebound at open in Hong Kong, Shanghai
Hong Kong stocks rallied in the first few minutes of trade Tuesday, rebounding from the previous day's losses and tracking New York gains as dealers looked past the collapse of weekend talks to limit oil output.

Making Sense Of The EUR/CHF Relationship
The strong correlation between EUR and CHF currency pairs is undeniable. Find out what it means for forex traders.

The Eurozone Crisis And AAA Ratings
The eurozone's healthier economies' exposure to weaker economies is threatening their coveted AAA ratings.
RESOURCES & OFFERS

Free Investing Newsletter on Asian and Australian markets. Be ahead of the curve with TheBull.
Read more
Join CommSec now and get $600 free brokerage.
Find out more